Reports
Usage
For analytical purposes, CRMdesk has two powerful reporting tools: Custom Reports and Web-Query. As Web-Query requires no customizing and the settings are maintained each time it is executed, this component will be discussed further.
Reports are used to analyze the efficiency of your question flow by selecting and aggregating statistics on different areas, such as number of questions, their resolution time, etc. Figures can be grouped by different attributes or be presented ungrouped (by question). You can also choose a presentation format: both table and chart (pie, horizontal/vertical bar, or line) controls are available.
Path
Setup tab – General Setup – Reports
Procedure
To change an existing report, click the report title in the Reports list or click the Add Report button to create a new one.
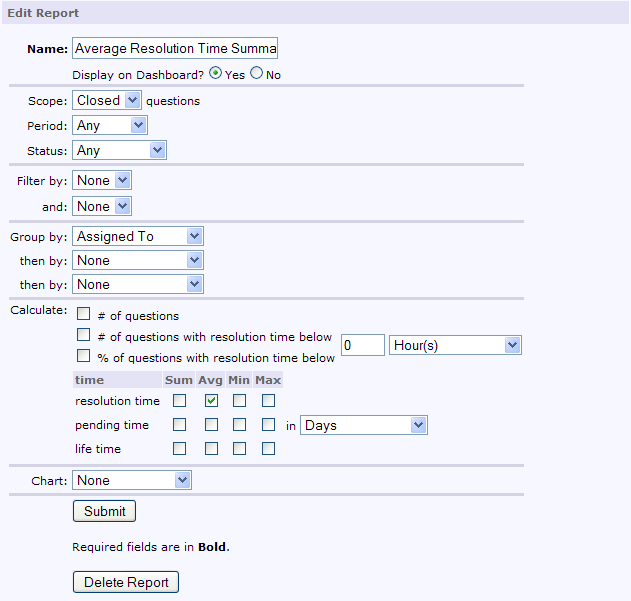
On the Report details page, maintain the following fields:
- Name (required) – a title that identifies the report;
- Display on Dashboard – select ‘Yes’ if you want the report to be executed and results displayed in the Reports Dashboard every time you open the Reports tab in the Support Desk;
- Scope – select whether you want to analyze open or closed questions or both;
- Period – specify the period when questions remained open or were closed;
- Status – select the status of questions that should be included into the report;
- Filter by – defines filtering criteria (see details below);
- Group by – defines the first, upper level of grouping in the report (see details below);
- Calculate # of questions – select this check box if you would like to see the number of questions in each group; if you want to see the number or percentage of questions with a certain resolution time, select the #(%) of questions with resolution time below check box and set the resolution time with the help of the text field and drop-down list;
- Time aggregation fields – are used to get a statistics on resolution, pending or life time (see details below);
- Chart – select the type of chart if you would like a graphical presentation instead of the table format for the report’s results; to represent results in a table, choose ‘None’ (default).
To save your changes, click the Submit button. To delete the report, click the Delete Report button at the bottom of the page.
Filtering Parameters
Filtering allows you to include into the report only those questions that match your specific criteria. You can filter questions by the information added with the help of custom fields.
From the Filter by list, select the custom field that contains the necessary information. Use further fields to create a filtering formula. As a result, the report will contain only those records that match your filtering criteria.
Grouping parameters
Grouping suggests that when a report is executed, time values are not shown for each separate question but for groups of questions formed based on a grouping attribute. For increased depth of analysis in CRMdesk reports, each first-level group can be split into smaller, second-level groups.
On the first level, you can use the following grouping options (the Group by area):
- No grouping (select ‘None’);
- Grouping by category (product/area) or standard question field or any customer or question custom field;
- Grouping by Opened or Closed event periods for some preceding time period (select the required breakdown periods).
On the second and third level, you can choose not to group questions, or group them in the same way as for the first level.
Aggregation parameters
Three types of values can be analyzed:
- Resolution time – total time a question had Awaiting Staff Response statuses;
- Pending time – total time a question had Awaiting Customer Response statuses;
- Life time – a sum of the previous two.
You may select time unit of measure:
- Minutes
- Hours
- Days
- Weeks
- Months
Four aggregation functions are available for each value type:
- Sum – the sum of all single values in each group;
- Average – the average of all single values in each group;
- Minimum – the smallest of all single values in each group;
- Max – the greatest of all single values in each group.
Example
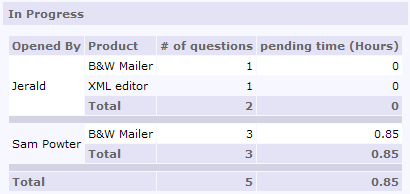
You want to check how many new questions are created by your customers. Field settings are the following:
- Scope: All questions
- Status: Open
Group by: Opened by
Then by: Product
Calculate # of questions: checked
Aggregation parameters: checked pending time (in hours)
When you execute a report, you get the following result:
Next: Subscription